Sprinting is one of the most decorated events in track and field and an essential basic skill for most sports that involve running. Competitive sprinters strive hard to reduce their sprint times, with the current world record for 100m sprint being 9.58, held by none other than Usain Bolt. A crucial aspect that determines sprint performance is the sprint start, i.e., right from the blocks! The athlete’s sprint start biomechanics strongly correlates with overall 100m time as 1/3rd of maximum velocity is achieved in the first couple of seconds of the race (1).
Types of Sprint Starts
The two primary types of sprint starts are:
Standing Start
Crouch Start (most effective for sprinting)
The Crouch Start is further divided based on the distance between the front and rear starting blocks:
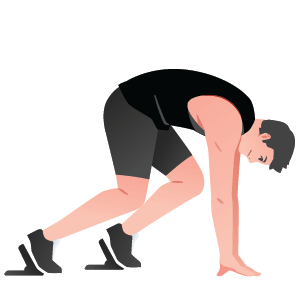
1. Bullet Sprint Start
Bullet Start
- Rear block is placed very close to the front block (<30 cm apart)
- The knee of the rear leg is positioned opposite the toe of the front foot
- Best for sprinters who prioritize quick reactions and high stride frequency
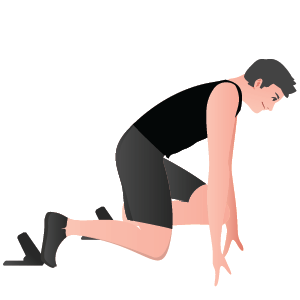
2. Medium Sprint Start
Medium Start
- Rear block is placed 30-50 cm behind the front block
- The rear knee is positioned opposite the arch of the front foot
- The most commonly used start—balances quick reaction, power, and acceleration
3. Elongated Sprint Start
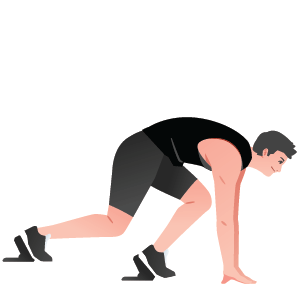
Elongated Start
- Rear block is placed >50 cm behind the front block
- The rear knee is positioned slightly behind the heel of the front foot
- Best for stronger sprinters who rely on explosive power over quick reaction as this position will allow greater hip extension ROM during start.
Types of Sprint Starts
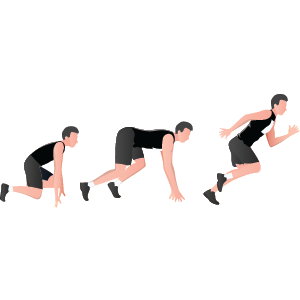
1. Block Phase
The block phase consists of two key positions:
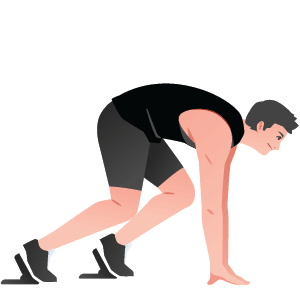
"On Your Mark"
Athlete positions feet on the blocks
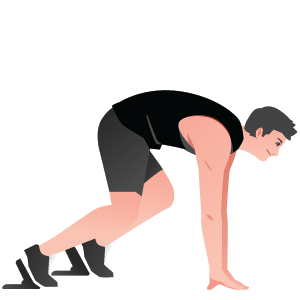
"Set Position"
Athlete raises their hips, preparing to explode forward
Key Factors in the Set Position of sprint start
- Block Spacing – Dictates the type of start (Bullet, Medium, or Elongated).
- Joint Angles – The following angles are optimal for an efficient start:
Bullet Start: Rear knee 90°-100°, Front knee 70°-80°
Medium Start: Rear knee 120°-135°, Front knee 90°
Elongated Start: Rear knee 135°-140°, Front knee 90°-100° - Block Inclination – The front block is typically set at 40°-55°, and the rear block at 45°-65°
Lower angles (~30°-40°): Increase block velocity but reduce stability. A lower angle creates a greater stretch in the calf muscles, leading to a more forceful push-off when leaving the blocks. The reduced stability is due to a smaller base of support, a forward-shifted center of mass, reduced rear foot contact.
Medium angles (~40°-55°): Provide the best balance of force and acceleration
Higher angles (~55°-65°): Improve stability but increase vertical force, reducing forward momentum. A higher angle can provide more leverage for athletes with less leg power, allowing them to generate more force against the blocks.
Optimal Joint Angles in the Block Phase of sprint start
(Subject to variability depending on block position and sprinter’s anthropometry)
- Front Knee Angle: ~99°
- Rear Knee Angle: ~136°
- Hip Flexion: Front hip 41°, Rear hip 80°
Total Body Center of Gravity (TBCG)
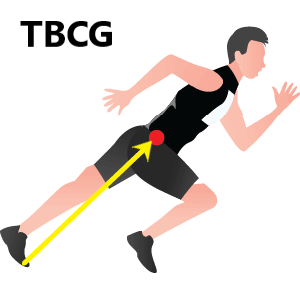
TBCG
- The closer the TBCG is to the start line, the faster the start.
- This is achieved by a forward trunk lean and a high hip position (above the shoulders).
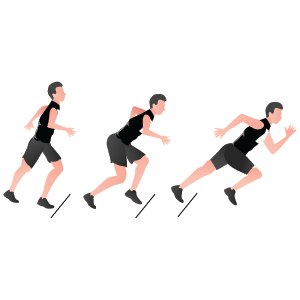
2. Block Clearance Phase
This is the “Go” Phase, where the athlete reacts to the starter gun and pushes off the blocks.
Key Biomechanical Factors
- Explosive Ground Reaction Force (GRF): High horizontal force application is crucial.
- Reaction Time: Elite sprinters react in 0.12 – 0.18 seconds.
- Rate of Force Development: The front leg produces greater impulse, while the rear leg generates higher force.
Joint Kinematics
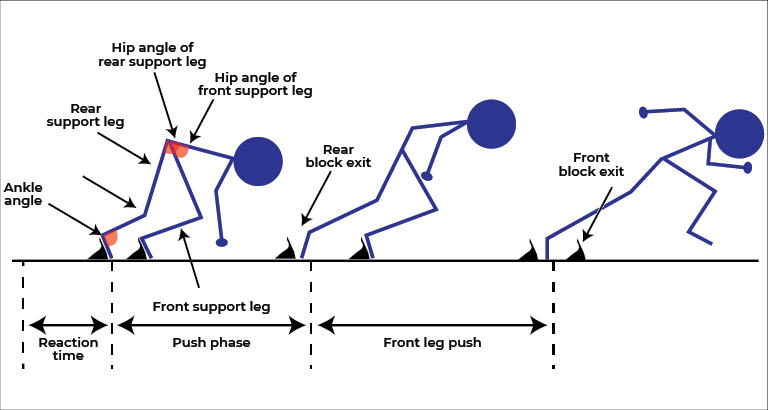
Joint Kinematics
- Ankle – Rear leg dorsiflexion, front leg plantarflexion
- Knee – Rear leg flexion, front leg extension
- Hip – Rear leg flexion, front leg extension
Muscle Recruitment Patterns
- Rear Leg Activation Order:
Gluteus Maximus → Hamstrings (Semitendinosus, Biceps Femoris) → Quadriceps → Calf - Front Leg Activation Order:
Gluteus Maximus → Biceps Femoris → Vastus Muscles → Calf (Soleus > Gastrocnemius due to knee flexion)
3. First Stance Phase (First Ground Contact)
Key Parameters for First Ground Contact
Joint Kinematics
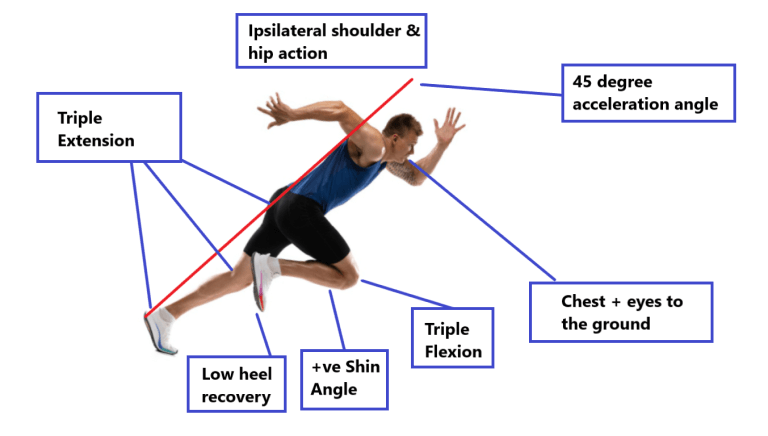
- Exit Angle: 40°-45° body angle (angle between the torso: a line from the hips to the shoulders and the ground (horizontal axis) ensures maximum horizontal propulsion while still generating sufficient vertical impulse to counteract gravity.
- Step Positioning: First foot landing behind the TBCG, enables immediate horizontal force application. If it lands too far ahead, it creates a braking force
- Ground Reaction Forces (GRF): The first braking force during ground contact is relatively small (-153N), but the propulsion phase produces a horizontal force of ~526N and a vertical force of ~431N
- Acceleration: Elite sprinters reach 8.68 – 11.77 m/s² at block exit
- Step Length: ~1.02m (Optimal balance of stride frequency and propulsion)
- Flight Time: The first flight phase lasts approximately 82ms, and the second flight phase is slightly longer (~101ms), which suggests that sprinters gradually transition from a block push to a cyclical stride pattern i.e., repetitive, circular motion of the legs
Biomechanical Factors Influencing Sprint Start Performance
1. Reaction Time during sprint start
- Definition: Time from the starter gun to movement initiation. Subdivided into
Pre-motor time: Neural processing time before muscle activation.
Motor time: Time taken for muscle activation to produce visible movement. - Effect on Performance: Faster reaction = better acceleration
- Elite Range: 100-150ms
- Testing: Electronic timing systems & EMG
- Interpretation:
Shorter reaction times are ideal but must be balanced with effective force application.
Poor reaction times suggest neural processing or focus issues
2. Ground Reaction Force (GRF) & Impulse
- Definition: The total force applied against starting blocks and ground during the start
- Effect on Performance: Higher horizontal force → faster acceleration
- Elite Sprinters: GRF = 4-5x body weight
- Testing: Force plates & 3D motion capture
- Interpretation:
Higher peak force → greater explosiveness.
Longer force application duration (impulse = Force × Time) → more effective acceleration.
3. Block Exit Velocity
- Definition: Velocity at block clearance
- Effect on Performance: Higher velocity = acceleration phase success.
- Elite Range: 3.4 – 3.9 m/s
- Testing: High-speed video & radar sensors
- Interpretation:
Higher block velocity reduces time to top speed.
Low block velocity suggests inefficiencies in force application or incorrect block settings.
4. Block Clearance Time
- Definition: Time from the gun to when both feet have left the blocks.
- Effect on Performance: Shorter block clearance time (~0.32-0.37s for elite sprinters) = effective push-off.
- Elite Range – 0.32-0.37s
- Testing Method: High-speed cameras, Force plate data synchronized with video.
- Interpretation:
Longer clearance time suggests poor power generation.
Excessively short times indicate premature movement with suboptimal force production.
5. Step Kinematics (Length & Frequency)
- Definition: Distance covered per step & number of steps per second
- Effect on performance – Optimal length and frequency = better acceleration
- Elite Range – 1.0 – 1.2m
- Testing: Marker tracking & pressure-sensitive tracks
- Interpretation:
Too long first step → excessive braking force.
Too short first step → inadequate propulsion.
Step frequency should increase progressively in early acceleration
6. Ground Contact Time (GCT)
- Definition: Time the foot stays on the ground
- Effect on performance: Shorter GCT = better acceleration.
- Elite Range: <0.17 – 0.19s
- Testing: Force plates & motion capture
- Interpretation:
Short GCT with high force = good stiffness & propulsion.
Long GCT = inefficient force transfer.
7. Joint Kinetics & Muscle Activation
- Definition: The torques & activation patterns of sprint-relevant muscles
- Effect on Performance: Strong hip extensors (gluteus maximus) & ankle plantarflexors improve force application
- Testing: EMG analysis & force plate data
- Interpretation:
Delayed muscle activation = weak neuromuscular coordination.
Low joint torques = insufficient strength in key muscle groups.
8. Total Body Center of Gravity (TBCG) Position during sprint start
- Definition: The sprinter’s centre of mass (CoM) relative to their foot placement.
- Effect on Performance: Better position = Faster exit velocity and faster acceleration
- Testing: 3D motion capture & force plate analysis.
- Interpretation:
A forward-leaning trunk (~45° at block exit) is ideal.
Too upright → loss of horizontal acceleration.
Too much forward lean → loss of stride efficiency due to forward COG shift, limited knee drive, disrupted ground contact and compromised core.
9. Horizontal vs. Vertical Force Ratio
- Definition: The ratio of forward-directed force to upward force.
- Elite Range: Generate >50% of their total force horizontally
- Testing Method: Force plate analysis.
- Interpretation:
Higher horizontal force → better acceleration.
Excessive vertical force → inefficient sprint start.
10. Acceleration & Power Output during sprint start
- Effect on Performance: Higher acceleration = better sprint start. Higher power = better acceleration.
- Elite Range: 10-12 m/s²
- Testing Method: Radar gun, Force Plate, Motion Capture
- Interpretation:
Low power output suggests insufficient explosive strength.
Acceleration should be smooth and progressive in early sprint phases.
We hope that this blog helped you get a clear understanding of sprint start mechanics!
Setting up your own biomechanics lab is now easier than ever. To learn more about GaitON’s analysis modules, contact us today!
Since you’re here…
…we have a small favor to ask. More people are reading our blogs everyday, and each week we bring you compelling content to help you treat your patients better. Please take a moment to share the articles on social media, engage the authors with questions and comments below, and link to articles when appropriate if you have a blog or participate on forums of related topics. — Team Auptimo
The information found within this site is for general information only and should not be treated as a substitute for professional advice from a licensed Physiotherapist. Any application of exercises and diagnostic tests suggested is at the reader’s sole discretion and risk.
ABOUT THE AUTHOR

GAYATRI SURESH (PT)
Gayatri Suresh (PT) is a Biomechanist who has completed her B.P.Th from DES College of Physiotherapy and M.P.T (Biomechanics) from SRM College of Physiotherapy, SRMIST. Her field of clinical expertise is in movement assessments through video analysis. Apart from her work at Auptimo, she works as a Clinical Specialist at Rehabilitation Research and Device Development, IIT Madras. She has been conferred with gold medals for her Research presentations and for securing First rank with distinction in her MPT degree respectively