Use of motion analysis software to measure the amount of rearfoot eversion in a patient with a history of ankle & knee pain.
ABSTRACT
Background: Excessive pronation (or eversion) at ankle joint has been linked with injuries due to muscle imbalance which disrupt normal lower limb alignment. This malalignment is thought to place undue stress and strain on the joints, ligaments, and muscles. (Masaun, Dhakshinamoorthy, & Parihar, 2009) Orthotics and inserts are often prescribed to limit the pronation range to tackle the problem (Fong, et al., 2008). This is a case study to investigate the effect of insoles prescribed to correct the amount of excess calcaneal eversion in a patient with a history of ankle & knee pain. The measurement of the amount of rearfoot eversion was done using a motion analysis software GaitON (Auptimo Technologies LLP, India)
Method: A patient with a history of ankle & knee pain participated in walking trials in each of the following conditions: (1) barefoot, and shod condition with an insert with medial arch-heel support. Motions were captured and processed by a single camera motion capture system. Maximum rearfoot eversion was calculated by using the ‘Intersection Angle’ model. (Subtalar Joint Angle – Quintic Automatic Tracking)
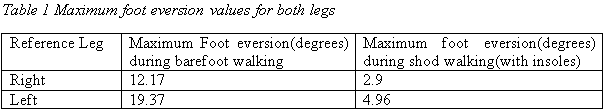
Results: Results showed that the inserts with medial arch-heel support were effective in reducing the maximum eversion by 14.41 degrees in the left leg and by 9.27 degrees in the right leg.
Conclusion: The GaitON (Auptimo Technologies LLP, India) motion analysis software allows a clinician to accurately and quickly identify and diagnose subtalar joint problems. It also enables detailed observation and control of an intervention/treatment in an objective way.
INTRODUCTION
During the stance phase of gait, the subtalar joint exhibits the triplanar, multiphasic motion commonly referred to as pronation. Foot pronation combines the movement of calcaneal (or rearfoot) eversion (frontal plane), forefoot abduction (horizontal plane) and dorsiflexion (sagittal plane) to aid in shock absorption during running (Buchbinder, Napora, & Biggs, 1979). Foot pronation, however, is difficult to quantify because of its three-dimensional nature and there is substantial variation in the orientation of the subtalar axis across subjects and joint positions (Kirby, 2001). Rearfoot angle or foot eversion-inversion is often used to estimate foot pronation-supination because this angle is relatively independent of motions in other joints, thus less prone to errors (Perry & Lafortune, 1995)
Furthermore, it has been demonstrated that rearfoot motion measured with either two-dimensional or three-dimensional analysis is essentially the same for the initial 80% of the stance phase (Hamill, Milliron, & Healy, 1994). Differences are increased as the foot moves out of the plane with maximum differences occurring during toe-off that affect the end of the rearfoot angle curve (from 80% to the end of the stance phase; (Hamill, Milliron, & Healy, 1994). Because the key phenomena regarding the rearfoot angle occur between 15% and 65% of the stance phase, a two-dimensional analysis can be considered adequate (Stergiou, Bates, & James, 1999).
Excessive pronation (or eversion) at ankle joint has been linked with injuries due to muscle imbalance which disrupt normal lower limb alignment. This malalignment is thought to place undue stress and strain on the joints, ligaments, and muscles. (Masaun, Dhakshinamoorthy, & Parihar, 2009) Orthotics and inserts are often prescribed to limit the pronation range to tackle the problem. (Fong, et al., 2008)
METHOD
A patient (age=26 yrs, male, height= 167.64cm, weight= 62kg) with a history of ankle & knee pain in both legs was asked to participate in a barefoot walking trial on an electronic treadmill with an aim to measure the maximum amount of rearfoot eversion. The patient was right-legged and was able to walk independently.
Passive markers were placed on both the lower extremity of the patient to provide reference points for determination of eversion angles.
Marker placement was as follows: (a) center of the sole on the heel of the shoe, or heel, for the barefoot condition; (b) centre of the heel tab, or calcaneus, in the barefoot condition; (c) centre of the Achilles tendon, just above marker b; and (d) centre of the calf, 20 cm above the Achilles tendon marker.
A posterior view of the lower extremity of the patient was obtained for the trials using a Nikon D5300 video camera with a frame rate of 60 Hz. The video camera was located 5m from the treadmill. A zoom lens was used in conjunction with the video camera to optimize image size and minimize perspective error.
The patient was instructed to walk at a normal comfortable pace on the treadmill. After 4-5 minutes of acclimatization, the video recording process was started. The walking speed was also noted down for future purposes.
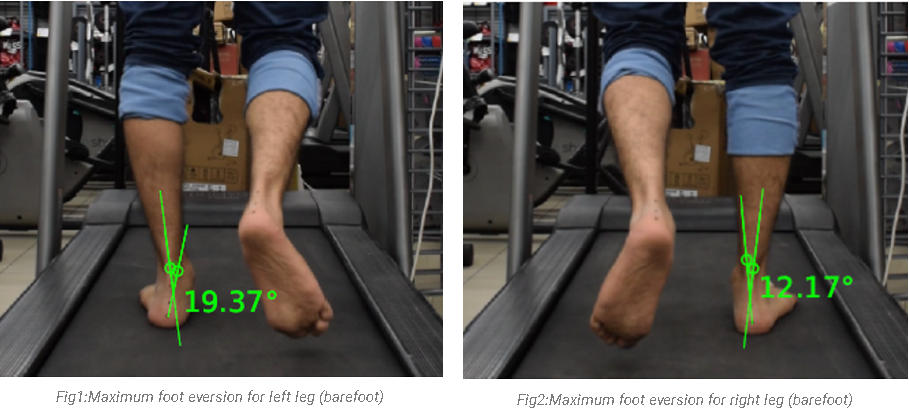
The videos were then opened in GaitON software (Auptimo Technologies LLP, India). The surface markers were digitized for each frame and the frame corresponding to the maximum eversion for each leg was identified. The eversion values were noted using the ‘Intersection Angle’ model. (Subtalar Joint Angle – Quintic Automatic Tracking).The maximum eversion for the right leg and left leg was noted as 12.17̊ and 19.37̊ respectively. (Table 1)
RESULTS
The data analysis from table 1 and figure 1, 2 reinforce that the maximum subtalar eversion for each leg is significantly greater than the normal range of 1-6̊. (Jenkyn & Anas, 2009)
Based on the above data, the patient was prescribed insoles for both feet. Once the insoles were fit into the patient’s daily footwear, the same walking trials conditions were repeated at the previously noted treadmill speed. The markers on the tibia stayed on the same place as the test before.
The maximum eversion values from the walking trial in shod condition (with insoles) were noted down for both the lower extremities. (Table 1)
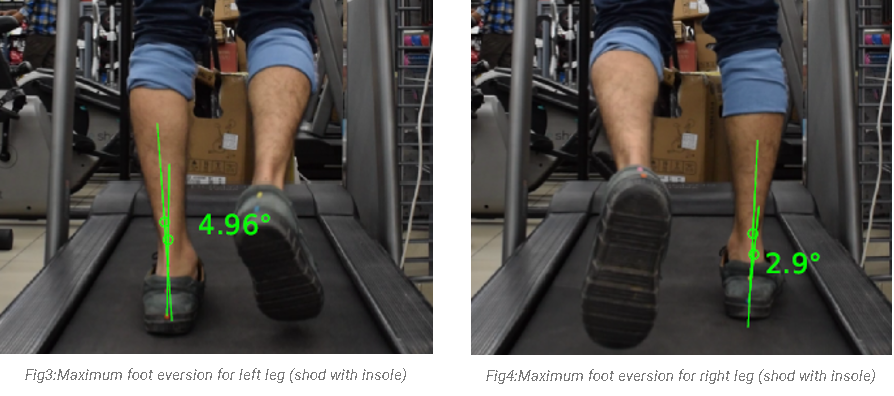
The data analysis from table 1 and figure 3, 4 reinforce that the insoles helped the patient in bringing down the maximum subtalar eversion back into the normal range of 1-6̊. (Jenkyn & Anas, 2009)
CONCLUSION
The GaitON (Auptimo Technologies LLP, India) motion analysis software allows a clinician to accurately and quickly identify and diagnose subtalar joint problems, while also enabling detailed observation and control of an intervention/treatment in an objective way.