Convergent validity and reliability of a new 2D motion analysis system for quantification of hip and knee kinematics during over-ground running.
ABSTRACT
Introduction: Analysis of running gait is necessary for prevention of hip and knee injuries. 2D motion analysis systems are being widely used at a clinical level for quantification of kinematic parameters during running gait analysis. Observational methods of assessing gait are largely dependent on clinicians’ ability to quantify and analyze the kinematic data in a reliable manner. Under these circumstances, use of motion analysis software with inbuilt running gait analysis protocols help to improve the reliability of data.
Objective:To investigate the convergent validity, inter- and intra-rater reliability of a 2-D motion analysis system (GaitON) for quantification of hip and knee kinematics at initial contact during running.
Methods: 21 healthy male recreational runners were recorded using a clinical 2D video setup during over-ground running. Two blinded raters quantified joint angles on video using GaitON and Kinovea software.
The intra-rater reliability [intra-class correlation coefficient (ICC 3, 1)], inter-rater reliability, the limits of agreement (LOA) in the Bland-Altman plot were also determined.
Results: The angles quantified using GaitON were significantly correlated with the angles quantified in Kinovea with r = 0.997; p = 0.01 for the hip and r = 0.982; p = 0.01 for the knee. The ICC values (intra-rater reliability) for the hip and knee were 0.998 and 0.990 respectively whereas ICC values (inter-rater reliability) of 0.996 and 0.978 were computed for the hip and knee respectively.
Conclusion: The strong validity and excellent inter- and intra-rater reliability results establish a concrete foundation for use of GaitON- a 2D motion analysis system as a tool for evaluating the running gait of a patient in a clinical setup.
Key words: kinematics, 2D motion analysis, running, knee and hip angles, validity, reliability
INTRODUCTION
The popularity of running as a sport and recreational activity has risen up remarkably in the past few years. Statistics show that there are approximately 2 million(1) recreational runners in the UK and an estimated 10 million in the US. This increase is even greater in Asian countries with India leading the statistics with a 154.78% growth in marathon runners from 2009 to 2014(2).
With an increase in the running activity all over the world, studies have reported a rise in the running-related injuries both at competitive and recreational level(3). The injury among runners training for a marathon has been recorded as high as 90 % (4), while the annual cumulative injury incidence proportion in a general running population has been reported up to 85% (5). A majority of these injuries include patellofemoral pain syndrome, iliotibial band syndrome and stress fractures to the tibia and metatarsal bones(6).
In order to decrease the frequency and the impact of running-related injuries (RRI), and establish sufficient prevention strategies it is important to understand the etiology and mechanisms associated with these injuries(7).
A common risk factor behind many running related injuries is the increased joint load at the moment of initial contact (foot strike)(8). Additionally, sagittal plane kinematics of the hip & knee has also been shown as a very useful indicator of joint kinetics & ground reaction forces(8). ‘Overstriding’ is one such running pattern that consists of excessive hip flexion & knee extension at initial contact, resulting in a greater loading to the hip and knee joints and a higher risk for injuries (6,9).
Objective measures of assessment of running gait help to understand abnormal biomechanics that may contribute to injury in runners(10). The advancements in gait analysis technology allows clinicians to break down the running gait cycle into phases and focus on lower body biomechanics in detail. There are different systems available for measuring kinematic data during running. Three-dimensional (3-D) motion analysis is widely accepted as the gold standard for assessing running biomechanics. However, due to its high cost and lack of portability, the utilization of this system is limited to only selected clinics or institutions(3).
A 2D running gait analysis system, is a more affordable and practical solution for field research and clinical use. It uses 2 digital cameras to capture the motion of a runner from the anterior, posterior and the lateral views. Each view is then analyzed by a motion analysis software to obtain information regarding kinematic and kinetic parameters for assessment of biomechanics of running.
There are a number of software available that are widely used by clinicians for conducting a 2D running gait analysis. One such software is Kinovea (version 0.8.15, available for download at (http://www.kinovea.org), a freeware shown to have high levels of inter and intra-rater reliability, especially during measurement of sagittal plane variables in case of running(7,11). However, the limitations of this software are that the measurements of joint angles have to be done manually so the analysis time is more.
In the present study, we have used a new 2D motion analysis system called GaitON (Auptimo Technologies LLP, India) to investigate the hip and knee running mechanics of a group of runners. We measured the hip and knee angles at the initial contact phase according to Ranchos Los Amigos classification(12). GaitON has an inbuilt running analysis protocol which reduces the number steps required for manual marker digitization, resulting lesser measurement variations & reduced analysis time. If proved valid and reliable, GaitON has potential to become an efficient tool for running gait analysis.
Therefore, the aim of the present study is to calculate the validity of the data measured using motion-analysis software Kinovea (version 0.8.15) and GaitON (v 1.0.1) respectively. This study also establishes inter- and intra-rater reliability of the angles quantified in GaitON software.
METHODs
Participants
Twenty-one healthy male runners (age 18.8 ± 8.2 years, height 172.8 ± 11.8 cm, weight 67.2 ± 12.1 kg), who volunteered to participate in the study were enrolled in the period from November to January 2018. The study was conducted as per the ethical principles set forth in the declaration of Helsinki. The purpose and possible risks of the study were explained to all participants. All the participants provided written informed consent.
Inclusion criteria consisted of a) healthy participants engaged in the absence of lower extremity injuries three months preceding baseline and regular recreational running with a minimum weekly mileage of 20km per week (13). Subjects were excluded if they were currently under medical supervision and not fully cleared to participate in a structured running program.
Procedure
Participant Preparation
All the participants were provided clothing instructions for the video capture process. This included no upper body clothing and tight fitting shorts for the lower body. The correctness of the clothing of every participant was examined before the video capture process. In case the lower body clothing of any participant was found to be loose, Velcro-straps were used to tighten it up.
Marker Placement
Self-adhesive markers of diameter 15 mm were placed on the greater trochanter of the femoral head, lateral condyle of the femur and the lateral malleolus of the foot for measuring the knee flexion/extension and hip flexion/extension angles in the sagittal plane. All the markers were placed on the right extremity(7).
Video Capture
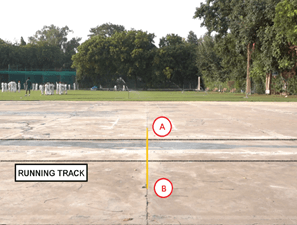
The runners were asked to run on a straight running track of 50 meters while wearing their regular running shoes. They were allowed to do 5 minutes of warm-up runs before shooting the video for the analysis. The same running track was used during both warm-up and motion capture for all participants. The runners were instructed to run at a speed they would normally do during a usual over-ground running session. All participants were supposed to run between two parallel lines marked along the length of the track. (Fig 1)
Equipment Specification
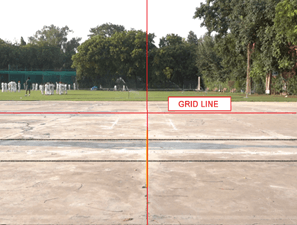
A high-speed video camera (Sony Rx100 Mk IV resolution 1920x1080p at 100fps and shutter speed at 1/250 second) was mounted on a professional video recording tripod set at a height of 0.63m. For camera calibration and to minimize perspective error, the camera was located at a distance of 5 meters from the running track. The bubble level available on the camera tripod was used to level the camera about its pitch and roll axis. Further, the camera optical axis was aligned perpendicular to the plane of movement using grid calibration method as shown in figure 1 and 2.
Measurement of Hip and Knee Angles
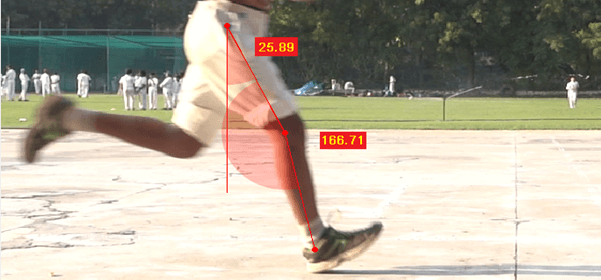
The hip and the knee angles in the sagittal plane were measured and quantified for the validity and reliability study. This technique of measurement of both these angles using 2D software have been shown to have a sufficient level of reliability in previous studies [8]. In order to establish consistency in the process of quantifying these angles, a standardized protocol was followed. Knee flexion/extension was measured as the angle between the line connecting the markers on the greater trochanter of the femur and the lateral condyle of the femur and the line connecting markers on the lateral condyle of the femur and the lateral malleolus(14). Similarly, the hip flexion /extension was quantified as the angle between the vertical line perpendicular to the ground and the line connecting the markers on the greater trochanter of the femur and the lateral condyle of the femur(14) (Figure 3).
Two experienced physiotherapists familiar with video-based quantification of joint angles in running were chosen as the blinded raters for the study. Prior to quantification, both the raters (Rater 1 and Rater 2) independently examined each video and excluded any video with poor illumination, blurriness or other video quality factors that could bias the digitalization of the video and thereby, the rater’s quantification of joint angles(7). 1 participant was excluded because of low video quality.
Following this, each rater was asked to independently identify the frame of initial contact in each video.
IDENTIFICATION OF THE VIDEO FRAME FOR INITIAL CONTACT:
The instant of initial contact (foot strike) in every video file was identified and fixed to ensure that the raters measured the knee and hip angles at the same frame in the video. Identification of this frame was conducted through a four-step procedure: 1) The video file was loaded in GaitON software 2) The two raters independently identified the moment of right initial contact of the runner, 3) Step 1 and Step 2 were repeated after 14 days. 4) Based on the four identification sessions (two sessions from each rater) of the initial contact frames, the fixed video frame for the initial contact (foot-strike) was defined as the median initial contact frame, rounded up to the forthcoming frame if the median was between two video frames.
Additionally, the frame number identified in each video using the above process was noted down and was used for quantification of joint angles for both validity and reliability measurements.
The quantification process was carried out on 2 separate days, kept 2 weeks apart (Day 1 and Day 14). On Day 1, Rater 1 was asked to compute the hip and knee joint angles using both GaitON and Kinovea software, while Rater 2 was asked to compute the hip and knee joint angles using only GaitON software.
On Day 14, Rater 1 was again asked to compute the hip and knee joint angles using only GaitON software.
The data obtained by Rater 1 using both GaitON and Kinovea software were used for the validity study between GaitON and Kinovea angles.
The readings of angles marked by Rater 1 in GaitON software on Day 1 and Day 14 were used to calculate intra-rater reliability.
In order to assess the inter-rater reliability, the angles marked by Rater 1 and Rater 2 on GaitON software on Day 1 were used for analysis.
DATA ANALYSIS
Sample Size Calculation
With an alpha level of 0.05 and statistical power of 80%, for the testing of a null hypothesis intra-class correlation coefficient (ICC) value= 0.3, and an alternative hypothesis value of ICC= 0.7, the required sample size was 22 for two observations per patient. For convergent validity evaluation, a sample size of 19 achieves 80% power to detect a difference of -0.60 between the null hypothesis correlation of 0.00 and the alternative hypothesis correlation of 0.60 with a significance level of 0.05. A total of 21 participants were recruited in the study.
The data was first determined and checked for normal distribution. Normal distribution of data was assessed using histograms, Shapiro–Wilk (S-W) test, and the skewness analysis. Assumptions of normality were met. Therefore, all calculations of reliability and validity were based on parametric tests.
Convergent Validity
To assess the convergent validity of GaitON software, Karl Pearson’s product correlation between hip and knee angles on GaitON software and Kinovea values calculated by Rater 1 on Day 1 were computed. A correlation of 0.3 to0.5 was considered weak to fair, correlation of 0.5 – 0.75 was considered moderate and correlation of > 0.75 were considered strong(15).
Intra – Rater Reliability
Intra-rater reliability was assessed using GaitON angles obtained by rater 1 on day 1 and day 2 (14 days after day 1). A t-test was performed to check for any systematic error. It was assumed that there is a systematic error in the data if a significant difference is observed. The level of significance was set at 0.05.
ICC (3,1) of GaitON angles by rater 1 on day 1 and GaitON angles by rater 1 on day 2, were computed to determine the intra-rater reliability. It was considered to be excellent for ICC > 0.9 and acceptable for >0.75. Cronbach’s alpha model was used for computing ICC between both the outcome angles(16).
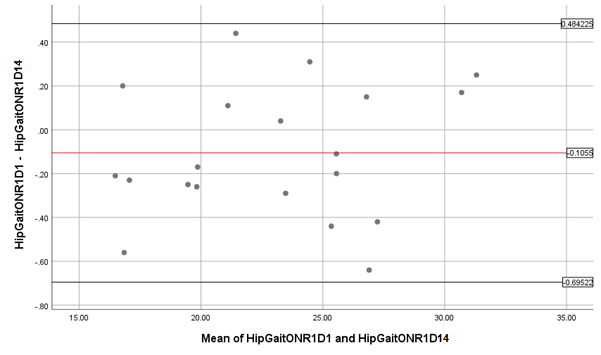
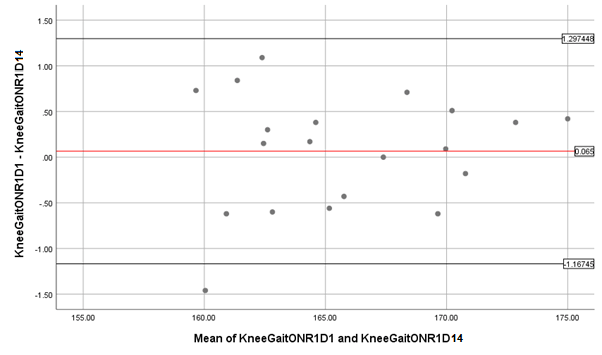
Limits of agreement between angles of days 1 and 2 were calculated using Bland and Altman plots. The plot consists of upper and lower limits that help in deciding (subjectively) whether the agreement between the angles taken on day 1 and 2 is acceptable or not.
Standard Error of Measurement (SEM) values were also obtained for the angles of day 1 and 2 using the formula: SEM= SD x√ (1-ICC)
Minimum Detectable Change (MDC) between the angles of day 1 and 2 was obtained using the formula: MDC= SEM x 1.96x √2= 2.77x SEM
Inter-Rater Reliability
For, calculating inter-rater reliability using GaitON angles, data obtained by rater 1 and rater 2 on day 1 was analyzed. The procedure for analysis was similar to calculating intra-rater reliability. A t-test was performed to check for any systematic error.
ICC (3,1) of GaitON angles by rater 1 on day 1 and GaitON angles by rater 2, was computed to determine the inter-rater reliability
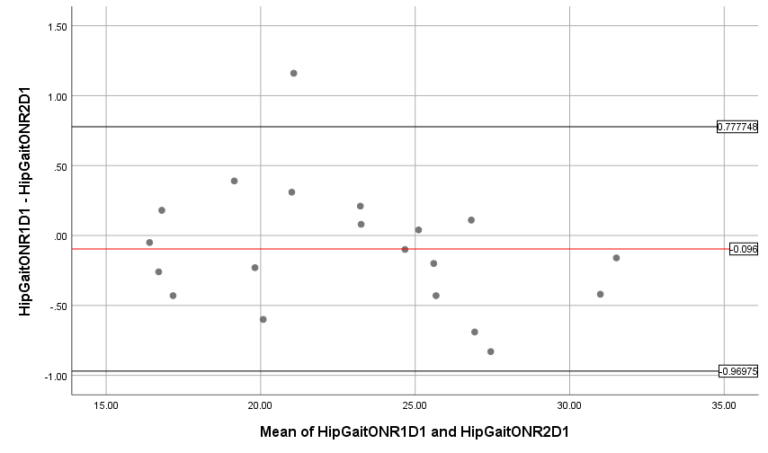
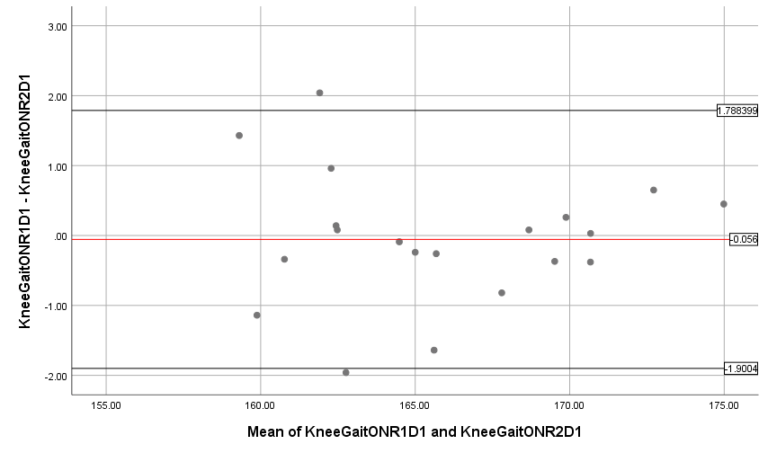
Limits of agreement between angles of rater 1 and 2 were calculated using Bland and Altman plots.
Standard Error of Measurement (SEM) values were also obtained for the angles of rater 1 and 2 using the formula: SEM= SD x √ (1-ICC)
Minimum Detectable Change (MDC) between the angles of rater 1 and 2 was obtained using the formula: MDC= SEM x 1.96 x √2= 2.77 x SEM.
RESULTS
A total of 21 healthy male subjects were recruited. The descriptive characteristics of all the participants such as age, gender, weight, height, BMI are shown in Table 1.
Characteristics | Mean(SD) |
Gender | M |
Age(y) | 18.8(8.2) |
Weight(kg) | 67.2(12.1) |
Height(cm) | 172.8(11.8) |
BMI(kg/m2) | 22.4(2.7) |
Table 1: Descriptive characteristics of all the participants such as age, gender, weight, height, BMI
Convergent Validity:
The angles of GaitON showed strong correlation with Kinovea with r = 0.997; p = 0.01 for hip and r = 0.982; p= 0.01 for knee also shown in Table 2.
Pearson Correlation | p | |
Knee Angle | 0.982 | 0.01* |
Hip Angle | 0.997 | 0.01* |
* Significant at 0.01.
Table 2: Convergent validity of GaitON and Kinovea
Intra-rater Reliability:
There was no systematic error found in the angles obtained by rater 1 on day 1 and day 2 as t-test was non-significant with p >0.05. The ICC was found to be excellent (ICC = 0.998 for hip and ICC = 0.990 for knee). The Bland Altman plot for hip showed that no data point lies outside the ± 1.96 SD, stating a high agreement and for Knee there was one point outside the -1.96 SD mark stating high agreement. The SEM and MDC were found to be 0.013 & 0.036 for the hip respectively and 0.062 & 0.171 for the knee respectively.
| Day 1 X(SD) | Day 14 X(SD) | ICC(3,1) | SEM | MDC |
Hip Angle | 22.9 (4.6) | 23.0 (4.5) | 0.998 | 0.013 | 0.036 |
Knee Angle | 165.8 (4.5) | 165.8 (4.4) | 0.990 | 0.062 | 0.171 |
Table 3: Summary of the statistical analysis for Day 1 and Day 14 measurements of the knee and hip angle for intra-rater reliability.
Inter-rater Reliability:
There was no systematic error found in the scores obtained by rater 1 and rater 2 as t-test was non – significant with p >0.05. The ICC was found to be excellent (ICC = 0.996 for hip and ICC = 0.978 for knee). The Bland – Altman plot for the hip revealed only one point lying outside the + 1.96 SD, stating high agreement. Similarly, the Bland- Altman plot for the knee also showed suitable agreement with only 1 point lying outside + 1.96D & 1 point lying outside – 1.96D. The Values of SEM and MDC were found to be 0.028 and 0.077 for the hip respectively and 0.139 & 0.385 for the knee respectively.
| Rater 1 X(SD) | Rater 2 X(SD) | ICC(3,1) | SEM | MDC |
Hip Angle | 22.9 (4.6) | 23.0 (4.7) | 0.996 | 0.028 | 0.077 |
Knee Angle | 165.8 (4.5) | 165.9 (4.5) | 0.978 | 0.139 | 0.385 |
Table 4: Summary of the statistical analysis for Rater 1 and Rater 2 measurements of the knee and hip angle for inter-rater reliability.
DISCUSSION
This growth in the popularity of running can be attributed to the low equipment requirement of the sport, which makes it an easy alternative for people to maintain their fitness levels. Apart from being a popular recreational activity, it forms the core of various sports at the competitive level.
In our study we established that GaitON software has high Convergent validity and good inter-rater and intra-rater reliability for running gait analysis. There have been a number of studies on 2D motion analysis systems and their applicability in running gait analysis as a more portable, and economical solution for clinical establishments when compared with the ‘gold standard’, i.e. a 3D motion analysis system.
Since these systems capture motion in only 2 dimensions and there may be chances of parallax and perspective errors during measurement(17) ;it becomes important to establish the validity and measurement accuracy of these systems before incorporating them as a part of the clinical decision-making process.
The validity of Kinovea and other 2D motion analysis software in comparison with 3-D motion analysis systems have been frequently investigated during walking and running activities. In a study on 20 recreational runners with normal rearfoot mechanics, McClay et al reported strong correlations between 3D and 2D sagittal plane data during running(8,18).
Another study by Fernández-González et al also evaluated the agreement between Kinovea and a three-dimensional motion system for detecting the joint angles of the hip, knee and ankle during the initial contact phase of walking.
Dingenen et al also compared the frontal plane joint angles measured through Dartfish, 2D motion analysis software (Dartfish, Fribourg, Switzerland) with the three-dimensional measured kinematic profiles during the stance phase of running. The authors reported a significant correlation between the 3D hip adduction kinematic profile and the 2D contralateral pelvic drop (CPD), femoral adduction & hip adduction angles. Furthermore, two-dimensional CPD was significantly related to the 3D CPD kinematic profile (19).
We used Kinovea for establishing validity of GaitON as it has previously been established as a reliable tool for running gait analysis (7,11). Reinking et al, used Kinovea software to establish the inter-rater and intra-rater reliability of 6 different raters varying in experience(11). The study reported high intra-rater ICC values for experienced raters (ICC: 0.75- 0.98) and inexperienced raters (ICC: 0.54-0.99) during assessment of eight sagittal plane variables, In the case of frontal plane variables, both the experienced and inexperienced raters demonstrated lower levels of intra-rater reliability.
In a separate study, Damsted et al investigated the intra-rater and inter-rater reliability of knee- and hip angles at foot strike during running using Kinovea(7).
The Intra-rater reliability of an instrument is a key property allowing researchers and clinicians to administer an analysis more than once to assess changes over time. GaitON hip and knee scores showed no systematic error. The ICC values of 0.998 and 0.990 showed an excellent reliability.
The mean difference calculated as part of LOA was small and there was one point outside the Knee LOA plot and no point outside the hip LOA plot. This showed high agreement between the measurements. Absolute reliability calculated through SEM was 0.013 for the hip and 0.062 for the knee.
Inter-rater reliability of an instrument is another important component that tells us whether the measurements differ if taken by different people. It helps in making the tool available for use by a variety of clinicians. The GaitON Hip and knee angles showed excellent inter-rater reliability for hip and knee angles.
The mean difference calculated as part of LOA was small and there was only one point outside the Hip LOA plot & 2 points lying outside the Knee LOA plot. This showed a suitable agreement between the measurements. Absolute reliability calculated through SEM was 0.028 for the hip and 0.139 for the knee.
The study results helped us to establish GaitON as a valid and reliable software for gait analysis in male runners. Proper precautions such as accurate physical setup and marker placement are needed to minimize parallax and perspective errors. If these are taken 2 D motion analysis systems can provide information about kinematic and kinetic parameters comparable with any 3D software. However the study had some limitations. Firstly, the current study involved quantification of knee and hip angles in sagittal plane only. Secondly, due to the amount of upper body exposure required, the participants who agreed to volunteer for the study were males. Despite these limitations, the study was instrumental in providing clinicians with a new software that is accurate for evaluating the running gait of a patient in a clinical 2D video setup. The software is reliable, simple and reduces total analysis time for a clinician.
REFERENCES
- Adharanand Finn. Why we love to run [Internet]. The Guardian. 2013 [cited 2020 Nov 22]. Available from: https://www.theguardian.com/lifeandstyle/the-running-blog/2013/feb/05/why-we-love-to-run
- Jens Jakob Andersen. Marathon Statistics 2019 Worldwide (Research) [Internet]. RunRepeat. 2020. Available from: https://runrepeat.com/research-marathon-performance-across-nations
- Siddharth Hans. A Protocol for Two-Dimensional Running Gait Analysis [Internet]. Simplifaster. 2018. Available from: https://simplifaster.com/articles/gait-analysis/
- van Gent RN, Siem D, van Middelkoop M, van Os AG, Bierma-Zeinstra SMA, Koes BW. Incidence and determinants of lower extremity running injuries in long distance runners: A systematic review [Internet]. Vol. 41, British Journal of Sports Medicine. BMJ Publishing Group; 2007 [cited 2020 Nov 22]. p. 469–80. Available from: /pmc/articles/PMC2465455/?report=abstract
- Nielsen RO, Buist I, Sørensen H, Lind M, Rasmussen S. Training errors and running related injuries: a systematic review. International journal of sports physical therapy [Internet]. 2012 Feb [cited 2020 Nov 22];7(1):58–75. Available from: http://www.ncbi.nlm.nih.gov/pubmed/22389869
- Richard B. Souza. An Evidence-Based Videotaped Running Biomechanics Analysis. Phys Med Rehabil Clin N Am [Internet]. 2016;27(1):217–36. Available from: file:///C:/Users/Carla Carolina/Desktop/Artigos para acrescentar na qualificação/The impact of birth weight on cardiovascular disease risk in the.pdf
- Damsted C, Nielsen RO, Larsen LH. Reliability of video-based quantification of the knee- and hip angle at foot strike during running. International journal of sports physical therapy [Internet]. 2015;10(2):147–54. Available from: http://www.ncbi.nlm.nih.gov/pubmed/25883863%0Ahttp://www.pubmedcentral.nih.gov/articlerender.fcgi?artid=PMC4387722
- Wille CM, Lenhart RL, Wang S, Thelen DG, Heiderscheit BC. Ability of sagittal kinematic variables to estimate ground reaction forces and joint kinetics in running. Journal of Orthopaedic and Sports Physical Therapy [Internet]. 2014 Oct 1 [cited 2020 Nov 22];44(10):825–30. Available from: /pmc/articles/PMC4297621/?report=abstract
- Bryan C. Heiderscheit, Elizabeth S. Chumanov, Max P. Michalski, Christa M. Wille MBR. Effects of Step Rate Manipulation on Joint Mechanics during Running. Med Sci Sports Exerc [Internet]. 2011;43(2):296–302. Available from: %3CGo%5Cnto
- Maykut JN, Taylor-Haas JA, Paterno M v, DiCesare CA, Ford KR. Convergent validity and reliability of 2d kinematic analysis of frontal plane motion during running. International journal of sports physical therapy [Internet]. 2015;10(2):136–46. Available from: http://www.ncbi.nlm.nih.gov/pubmed/25883862%0Ahttp://www.pubmedcentral.nih.gov/articlerender.fcgi?artid=PMC4387721
- Reinking MF, Dugan L, Ripple N, Schleper K, Scholz H, Spadino J, et al. Reliability of Two-Dimensional Video-Based Running Gait Analysis. International Journal of Sports Physical Therapy. 2018;13(3):453–61.
- Perry J, Burnfield JM. Gait Analysis: Normal and Pathological Function [Internet]. Vol. 9, ©Journal of Sports Science and Medicine. 2010 [cited 2020 Nov 22]. 353. Available from: http://www.jssm.org
- Lun V, Meeuwisse WH, Stergiou P. Relation between running injury and static lower limb alignment in recreational runners. Br J Sports Med [Internet]. 2004 [cited 2020 Nov 22];38:576–80. Available from: www.bjsportmed.com
- Michael W. Whittle. Gait Analysis An Introduction. 4th Editio. Elsevier. Philadelphia; 2007. 1–255.
- Leslie Gross Portney MPW. Foundations of clinical research: applications to practice. 3rd ed. New Jersey: Pearson/Prentice Hall; 2009. 892.
- D L Riddle PWS. Interpreting validity indexes for diagnostic tests: an illustration using the Berg balance test. Ther, Phys. 1999;79(10):939–48.
- Kirtley Christopher. Clinical gait analysis: Theory and practice. 1st ed. London: Elsevier Ltd; 2006. 316.
- McClay KM. Three-dimensional kinetic analysis of running: significance of secondary planes of motion. Med Sci Sports Exerc. 1999;31(11):1629–37.
- Bart Dingenen, Filip F Staes, Lieselot Santermans, Lien Steurs, Maarten Eerdekens, Jurre Geentjens, Koen H E Peers, Maarten Thysen KD. Are two-dimensional measured frontal plane angles related to three-dimensional measured kinematic profiles during running? Phys Ther Sport. 2018;29:84–92.